Agentic AI Analytics Workspace
Uncover insights through multi-autonomous data agents, conversational analytics, and secure collaboration. Turns complex data into clear recommendations and measurable results.
- Autonomous
- Insightful
- Secure


Agentic AI Analytics Hub
Access data, analyze, collaborate in a single environment
Pollinetic orchestrates a collection of cooperative AI agents, each specialized for tasks like data discovery, querying, visualization, monitoring, and explanation.
Agentic Analytics
Autonomous AI agents handle data discovery, querying, anomaly detection, and root-cause analysis, working to improve accuracy and reduce errors
Connected Workspace
Enables teams to co-create analyses in real time, with versioned analytics threads that capture history and turn insights into a reusable knowledge base
Governed Connectivity
Native connectors link data sources and business tools, with centralized semantic layer for consistency and fine-grained controls for governed access
Continuous Intelligence
Automatically monitors key metrics, alerts to anomalies, and uses agents to explain changes, run scenario analyses, and suggest experiments for any data shifts
Agentic Analytics
Autonomous AI agents handle data discovery, querying, anomaly detection, and root-cause analysis, working to improve accuracy and reduce errors.
Connected Workspace
Enables teams to co-create analyses in real time, with versioned analytics threads that capture history and turn insights into a reusable knowledge base.
Governed Connectivity
Native connectors link data sources and business tools, with centralized semantic layer for consistency and fine-grained controls for governed access.
Continuous Intelligence
Automatically monitors key metrics, alerts to anomalies, and uses agents to explain changes, run scenario analyses, and suggest experiments for any data shifts.
Trusted Insights
Built for data teams, accessible to everyone
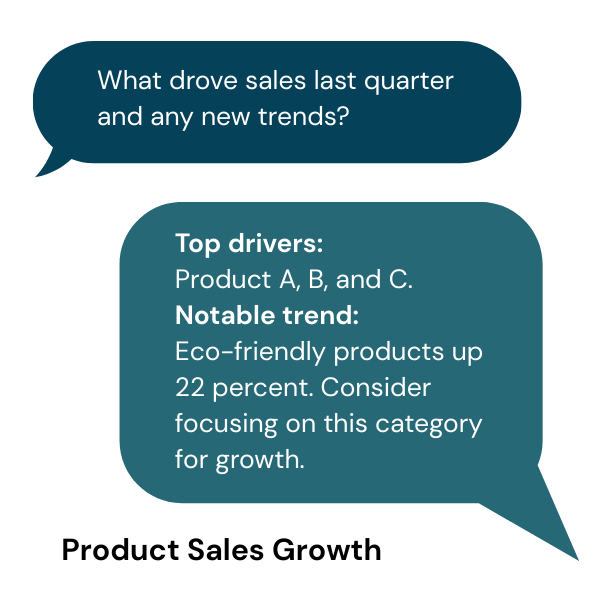
Ask in plain language, and AI agents handle data discovery, analysis, and team-specific storytelling.
-
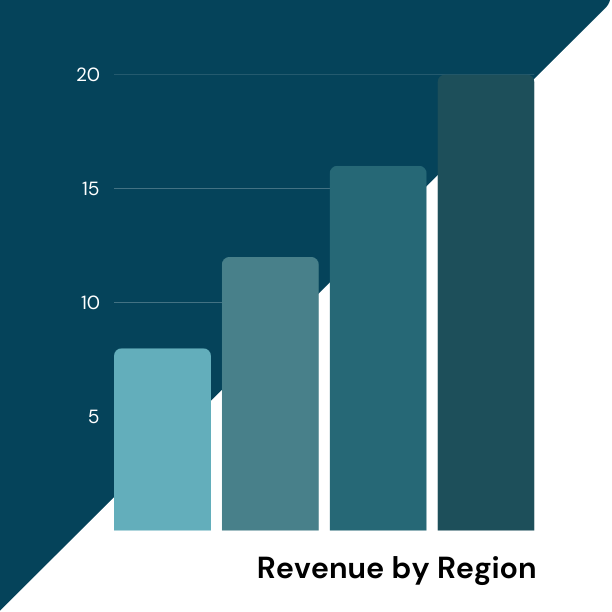
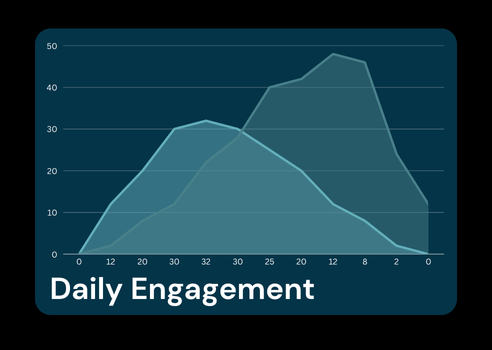
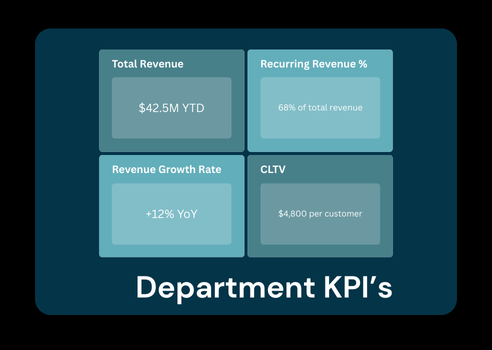
Executive Dashboards
-
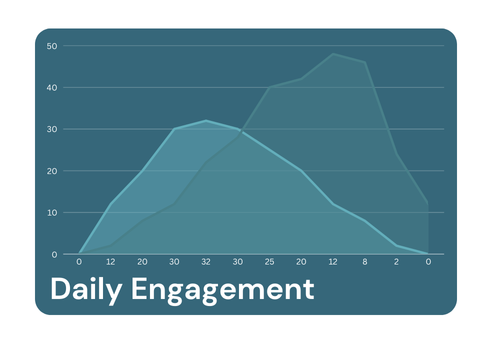
Project Analytics
-
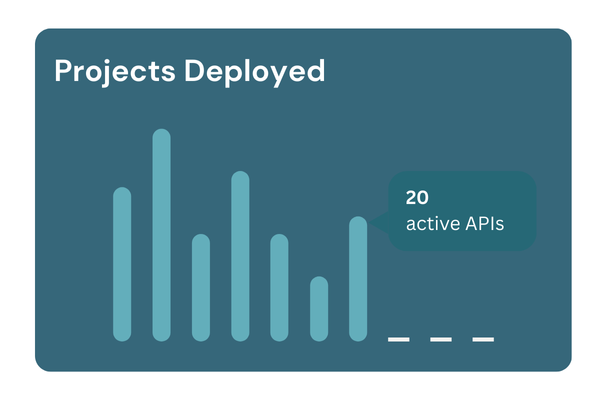
Operations Stories
Dual-Mode Analytics
Unlock around-the-clock visibility
Autonomous AI agents surface insights day and night to keep you continuously informed.
-
Deterministic mode
-
Interactive mode
-
Unified Metric Logic
Key Benefits
One Workspace, Unlimited Insights
Enhance your analytics initiatives under one powerful workspace. Enjoy the benefits created by experts.
Self-Service Analytics
Empower Teams with Governed Analytics
Streamline self-service analytics for data teams, giving business users instant answers and turn repeat queries into reusable agent playbooks to speed up decision-making.
Connect Seamlessly
Seamless Integration for Unified Insights
Integrate multiple data sources for streamlined, unified insights, enabling faster decision-making, improved data accuracy, and comprehensive visibility across all business functions.
Cost Savings
Maximize Cost Efficiency in Data Operations
Lower spend on custom reports, pipelines, and rework while reducing project timelines, improving data consistency, and enabling teams to focus on higher-value priorities.
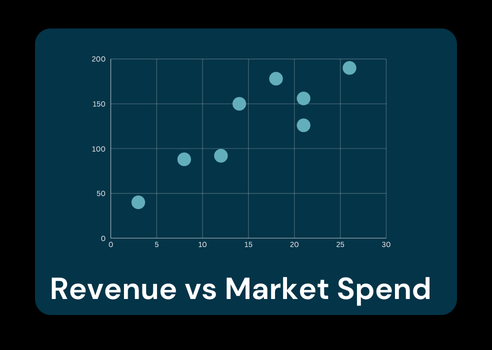
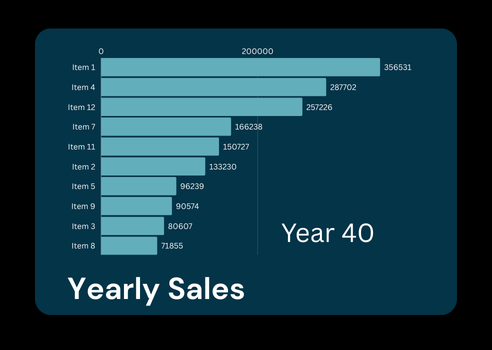
Interactive Dashboards
Enhanced Analytical Insights Across Departments
Gain specific drill-downs for various business functions, empowering teams to quickly identify trends, uncover actionable insights, optimize performance, and make data-driven decisions.
-
Cut ad-hoc requests with self-service analytics, giving users fast, clear answers.
Self-Service Analytics -
Integrate multiple business tools and data sources for streamlined, unified insights.
Connect Seamlessly -
Achieve up to 40% lower spend on custom reports, pipelines, and rework.
Cost Savings -
Specific drill-downs for analysis into finance, operations, marketing, sales, etc.
Interactive Dashboards
Empower Teams with Governed Analytics
Streamline self-service analytics for data teams, giving business users instant answers and turn repeat queries into reusable agent playbooks to speed up decision-making.
Seamless Integration for Unified Insights
Integrate multiple data sources for streamlined, unified insights, enabling faster decision-making, improved data accuracy, and comprehensive visibility across all business functions.
Maximize Cost Efficiency in Data Operations
Lower spend on custom reports, pipelines, and rework while reducing project timelines, improving data consistency, and enabling teams to focus on higher-value priorities.
Enhanced Analytical Insights Across Departments
Gain specific drill-downs for various business functions, empowering teams to quickly identify trends, uncover actionable insights, optimize performance, and make data-driven decisions.
Security & Governance
Secure governance to safeguard every step
A core platform combining orchestrators, LLM and deterministic tools, validators, and database-driven governance (rules, schemas, runtime policies) with streaming UX for step-by-step execution, previews, summaries, and interactive clarifications.
Guardrails & Governance
- Access is restricted using filters or DB row-level security, with scope sets cached per run for added protection.
- Full visibility and compliance are achieved through comprehensive audit logs that track all user actions.
- Governed data exchange is maintained through automated compliance checks and secure, controlled data sharing.
Security, PII & Access
- Enterprise-grade access and authentication use role-based control aligned with permissions, plus SSO.
- PII data is masked and never sent to LLMs, ensuring sensitive information stays secure in processing and analysis.
- Audit logs track queries, access, and key actions, while AI agents operate within the same permission boundaries as users.
Planning & Execution
- Flexible model integration supports multiple LLMs through pluggable adapters to easily switch between LLMs.
- Consistent quality controls are maintained through unified validation that ensures predictable behavior across models.
- Reliable governance is ensured through shared guardrails that maintain a consistent rule enforcement system-wide.
Driving Industry Impact
See how diverse organizations leverage Pollinetic
Explore how teams across industries use Pollinetic to streamline collaboration, unlock insights, and achieve greater operational efficiency.
Retail
Diagnose funnel drop-offs, and track margin and AOV shifts across channels.
Hospitality
Analyze optimizing occupancy, ADR, and RevPAR across properties.
Construction
Track metrics like CPI, SPI, RFIs, project performance, and safety incidents by site.
Higher Ed
Gain insights on student attrition risk, enrollment trends, and retention.
Retail
Diagnose funnel drop-offs, and track margin and AOV shifts across channels.
Hospitality
Analyze optimizing occupancy, ADR, and RevPAR across properties and segments.
Construction
Track metrics like CPI, SPI, RFIs, project performance, and safety incidents by site.
Higher Ed
Gain insights on student attrition risk, enrollment trends, and retention.
Insights from the makers
Hear directly from the Pollinetic team and discover their insights, experiences, and thoughts on the product.

“Pollinetic is transforming how teams use analytics. With Agentic AI, our customers gain actionable insights faster, collaborate more effectively, and achieve stronger results, all while maintaining robust data governance.”

“Pollinetic is designed to act like an always-on analytics partner. Our agentic architecture lets the system learn from past analyses and continuously refine how it understands your business over time.”

“Pollinetic gives business stakeholders self-service access to high‑quality insights, while allowing data teams to retain control over models, metrics, and governance.”
Questions answered
Find answers to common questions and learn more about Pollinetic.
- Ask questions in natural language (e.g., “Why did churn increase last month?”)
- Run cohort, funnel, variance, and segmentation analysis on demand
- Auto‑generate charts, tables, and executive‑ready narratives
- Set up metric monitors and anomaly alerts with explanations
- Collaborate on analyses in a shared workspace with full history and comments
AI agents are specialized components designed for specific parts of the analytics lifecycle, such as:
- Data discovery and source selection
- Query generation and optimization
- Visualization and storytelling
- Anomaly detection and root‑cause exploration
Pollinetic is designed to complement, not necessarily replace, existing BI tools. It:
- Sits on top of your current data infrastructure
- Handles ad‑hoc questions, investigations, and “why” analysis
- Reduces the need for one‑off dashboards and manual reports
Many teams continue using existing dashboards for routine monitoring, while Pollinetic handles deeper, interactive, and exploratory analysis.
Yes. Pollinetic is a collaborative workspace. Teams can:
- Share analyses and “threads”
- Comment and annotate within the workspace
- Reuse and adapt existing investigations as templates or playbooks
This turns ad‑hoc analysis into institutional knowledge that compounds over time.
Pollinetic is typically deployed to query data in place. In most setups:
- Data remains in your warehouse or systems of record
- Pollinetic issues secure queries and works with query results
- Configuration, metadata, and analysis artifacts are stored within Pollinetic.
We can discuss specific data residency and architecture options during implementation.
Most teams can connect core data sources and run initial analyses within days, depending on:
- Complexity of your data model and environments
- Existing semantic layers or metric definitions
- Number of systems and teams involved
We typically recommend a phased rollout, starting with a few high‑impact use cases.
It’s not mandatory to have a mature data warehouse but if you have one Pollinetic can connect to it, if not then we work with you to prioritize critical data sources to build pipeline for Pollinetic to work on.
We provide:
- Guided onboarding and configuration
- Training sessions for data teams and business users
- Best‑practice playbooks for common use cases by industry
- Ongoing customer support and product guidance
Yes. While the core platform is cross‑industry, we support tailored configurations and playbooks for verticals such as retail/e‑commerce, manufacturing, construction, and higher education, among others. We’ll work with you to align agents, metrics, and workflows with your specific needs.
Most tools route your question to a single model and return a one‑off answer. Pollinetic coordinates multiple specialized AI agents that:
- Identify relevant data and metrics
- Write and validate queries
- Produce visual and narrative analysis
- Monitor key metrics and surface anomalies over time
You don’t just get a chat reply—you get a living, reusable analytic workflow with context, history, and governance.